

| This Afternoon | Monday | Tuesday | Wednesday | Thursday | Friday | Saturday |
|---|---|---|---|---|---|---|
| | | | | | | |
| 83° F | 82° F | 83° F | 83° F | 87° F | 87° F | 87° F |
| 13 mph SE | 10 mph SW | 6 mph W | 1 to 7 mph SE | 2 to 8 mph SW | 3 to 8 mph SW | 3 to 8 mph SW |
| Chance Rain Showers | Showers And Thunderstorms | Mostly Sunny | Chance Rain Showers | Slight Chance Rain Showers then Chance Showers And Thunderstorms | Mostly Sunny then Chance Showers And Thunderstorms | Mostly Sunny then Chance Showers And Thunderstorms |
| Tonight | Monday Night | Tuesday Night | Wednesday Night | Thursday Night | Friday Night | |
| | | | | | | |
| 73° F | 66° F | 67° F | 71° F | 73° F | 73° F | |
| 7 to 12 mph S | 5 to 8 mph W | 1 to 5 mph SE | 2 to 7 mph S | 3 to 7 mph SW | 2 to 6 mph SW | |
| Chance Showers And Thunderstorms | Showers And Thunderstorms Likely then Partly Cloudy | Mostly Cloudy | Chance Showers And Thunderstorms then Slight Chance Showers And Thunderstorms | Chance Showers And Thunderstorms | Chance Showers And Thunderstorms |
Flood Watch issued August 2 at 2:29PM EDT until August 3 at 11:00PM EDT by NWS Upton NY
Onset: 2026-08-02T20:00:00-04:00Ends: 2026-08-03T23:00:00-04:00
Area: Western Passaic; Eastern Passaic; Hudson; Western Bergen; Eastern Bergen; Western Essex; Eastern Essex; Western Union; Eastern Union
Severity: Severe
Urgency: Future
Sender Name: NWS Upton NY
* WHAT...Flooding caused by excessive rainfall is possible. * WHERE...A portion of northeast New Jersey, including the following areas, Eastern Bergen, Eastern Essex, Eastern Passaic, Eastern Union, Hudson, Western Bergen, Western Essex, Western Passaic and Western Union. * WHEN...From 8 PM EDT this evening through Monday evening. * IMPACTS...Excessive runoff may result in flooding of rivers, creeks, streams, and other low-lying and flood-prone locations. Flooding may occur in poor drainage and urban areas. * ADDITIONAL DETAILS... - Rounds of heavy showers with embedded thunderstorms are expected tonight through Monday afternoon with locally high rainfall rates of 1-2"+ per hour possible. Any training of thunderstorms may result in localized flash flooding. - http://www.weather.gov/safety/flood
You should monitor later forecasts and be alert for possible Flood Warnings. Those living in areas prone to flooding should be prepared to take action should flooding develop.
CURRENT WEATHER CONDITIONS IN THE N.Y.C. REGION
The map window below is refreshed every 10 minutes

The weather data shown above comes from MADIS ( Meteorological Assimilation Data Ingest System ). MADIS collates data from federal, state and local agencies and then makes it available for public use. The MADIS data I use comes primarily from the New Jersey Weather and Climate Network and the Automatic Packet Reporting System ( APRS ). The round icons display current temperatures (°F). When the temperature icon equals or exceeds 90°F it turns red. Temperatures at or below 32°F are shown as blue. These stations range from Ocean City, Maryland to Provincetown, Massachusetts. This map was created primarily to help track the rain / snow line ( the 32°F isotherm ) as winter northeasters move up along the coast. It is also possible to see the cooling effect of sea breezes on coastal sites during the summer. Additional weather data for each station can be accessed in a pop-up table by clicking on the round temperature icons. These data are updated every 10 minutes.
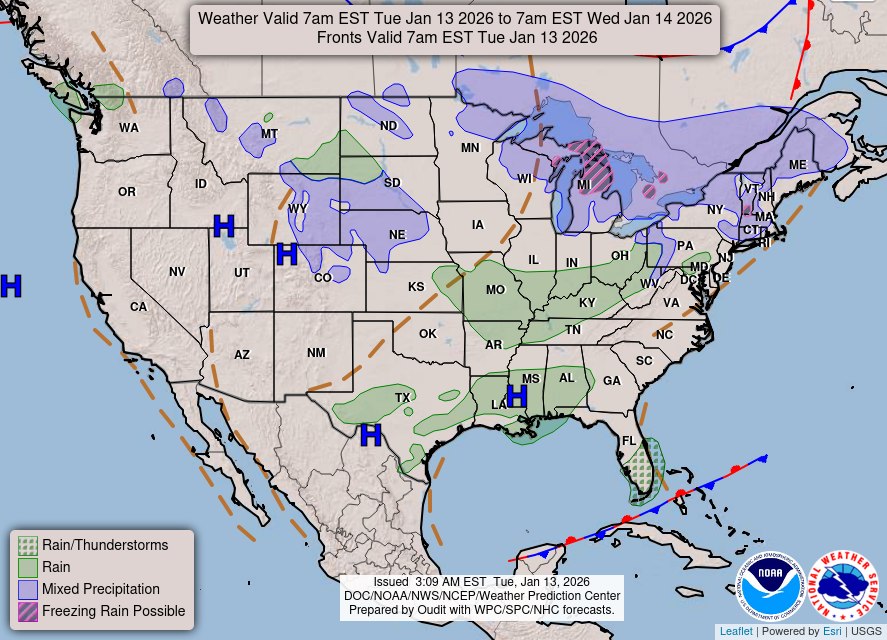
THE DAILY WEATHER MAP
WEATHER SUMMARY FOR JULY 2026
MONTH BEGINS WITH RECORD-SETTING HIGH TEMPERATURES
The average temperature this past July in Bergenfield was 77.4 (25.2°C). This is
0.7°F (0.4°C) above the long-term mean.
A maximum temperature of 104°F (40.0°C) was reached on the 2nd. The minimum
of 57°F (13.9°C) was recorded on the 20th.
Precipitation was well above normal at 9.29" (236.0mm)... about twice what we usually receive.
Despite of all the rainfall we still have a precipitation shortfall of more than 8" over the past 12 months.
The first 3 days of the month saw record breaking high temperatures with a maximum of 104°F on the
2nd followed by 102°F on the 3rd. A cold front passed though the region late on the 4th accompanied by
showers and damaging wind. I recorded a gust of 45mph(W). The 14th and 15th saw temperatures rise
above 90°F again. Heavy showers fell on the 21st when I recorded 1.75" of rain but the big precipitation
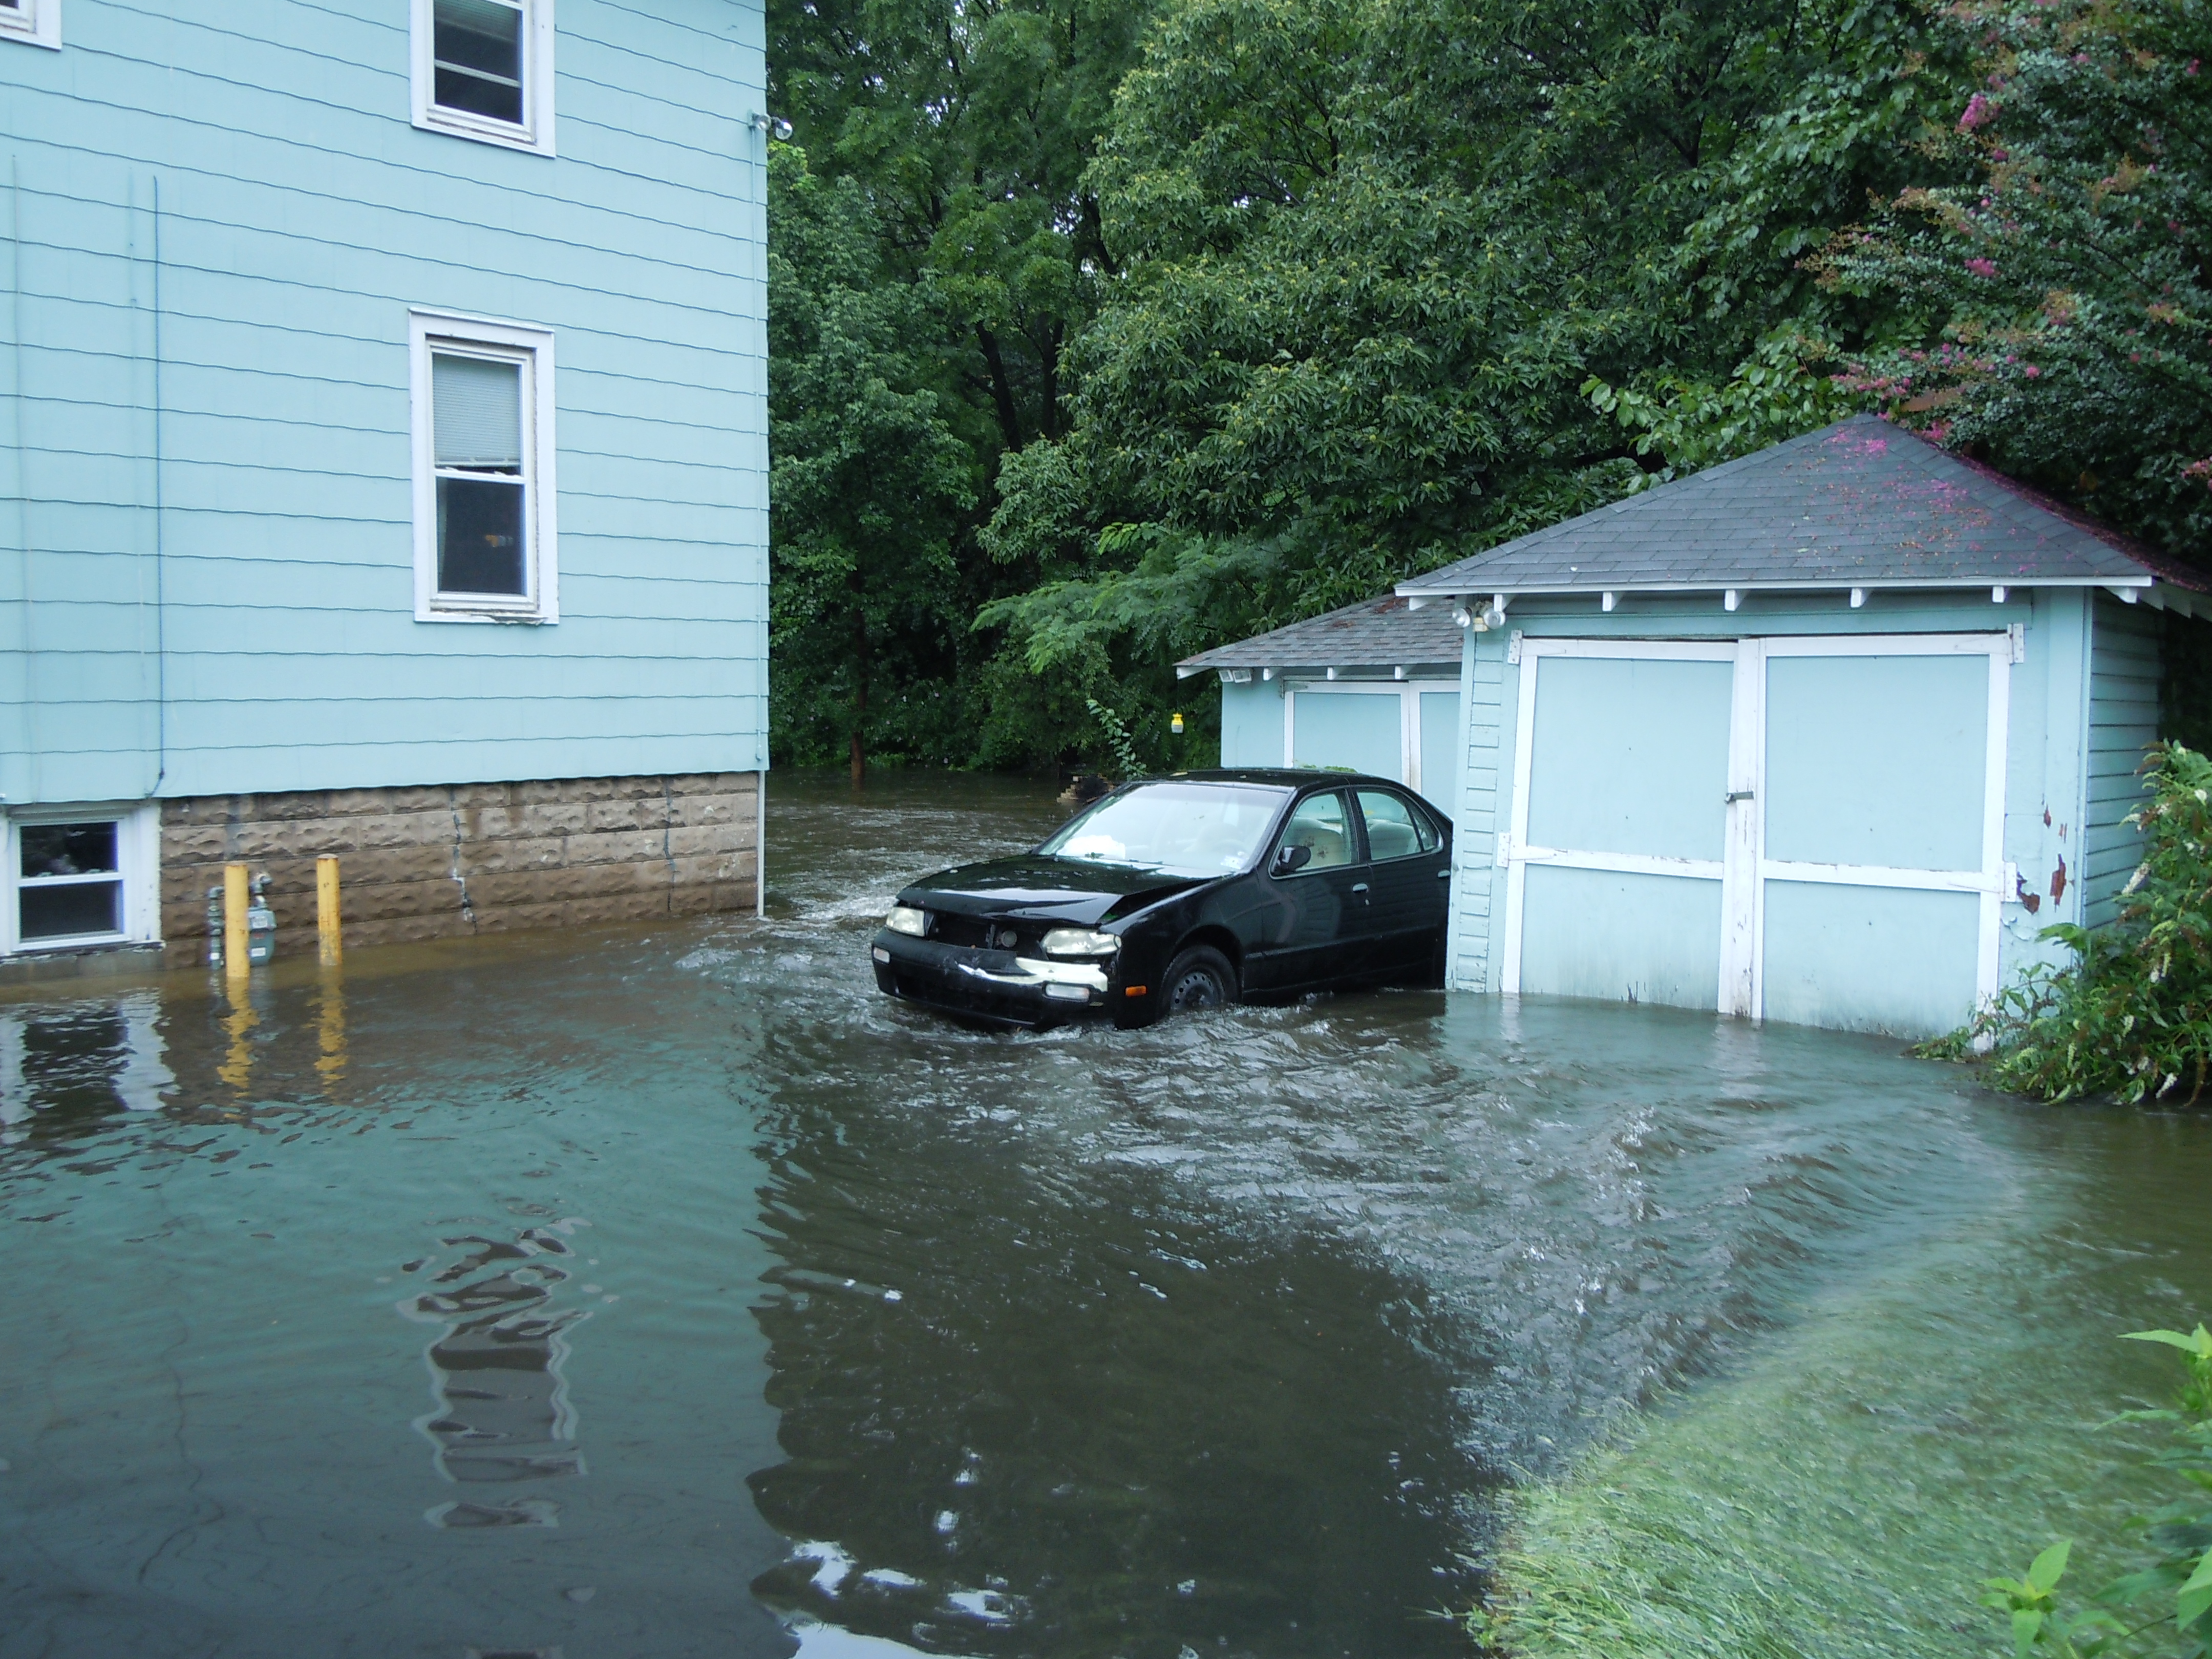
event of the month occurred on the 27th and 28th when almost 4" fell. Torrential rain with lighting and hail resulted
in flash floods and downed tree limbs. Low-lying streets were inundated and a number of stranded drivers
had to be rescued by the police and fire departments. All in all, it was a very eventful month in terms of the
weather.